Getting started with CITRUS
citrus.RmdInstallation
# install.packages("devtools")
devtools::install_github("peak-ai/citrus")
library(citrus)
library(dplyr)
Expected Data Model
In its current state, we are assuming that the input data is a transactions table with 4 required columns (transactionid, id, orderdate, transactionvalue). The preprocess function requires that these fields (or equivalent fields) are named in that manner. The function will raise a warning if these column names are not found.
Usage
Using the segmentation functions could be as simple as calling a one-liner:
output <- segment(citrus::transactional_data,
                  modeltype = 'tree',
                  steps = c('preprocess','model'),
                  prettify = TRUE,
                  print_plot = TRUE)
The above code uses default hyperparameters. There are two types of hyperparameters in this package, global ones and method specific ones. Global ones are independent of the method chosen and the method specific ones are related to the approach taken (eg. size of tree).
Hyperparameters
Hyperparameters can be passed into the functions at any time, most of the modules of the CITRUS pipeline has hyperparameters as a function input. The hyperparameters should be passed as a list as follows
hyperparameters = list(dependent_variable = 'response',
                       min_segmentation_fraction = 0.05,
                       number_of_segments = 6,
                       print_safety_check=20)
or for unsupervised k-means/modes
hyperparameters = list(centers = 'auto',
                       iter_max = 50,
                       nstart = 5,
                       max_centers = 5,
                       segmentation_variables = NULL,
standardize = TRUE)| Type | Method | Hyperparameter Name | Description |
|---|---|---|---|
| Global | segmentation_variables |
array, names of all variables to segment on |
|
| Global | saveoutput |
boolean, saves the output to local directory if TRUE |
|
| Method | tree | dependent_variable |
character, name of the variable to be used as dependent variable |
| Method | tree | min_segmentation_fraction |
numeric, the maximum size of the smallest possible segment (0.05 is 5% of the number of customers passed) |
| Method | tree | number_of_segments |
numeric, the number of segments to be produced |
| Method | unsupervised | centers |
numeric or string, either the number of clusters, or a set of initial (distinct) cluster centres, or ‘auto’. When ‘auto’ is chosen, the number of clusters is optimised |
| Method | unsupervised | iter_max |
numeric, the maximum number of iterations allowed |
| Method | unsupervised | nstart |
numeric, how many random sets of cluster centers should be tried |
| Method | unsupervised | max_centers |
numeric, maximum number of possible clusters when set to auto (the number of clusters is being optimised) |
Modularity was a primary design consideration when building CITRUS. This allows you to use certain functions as and when you need them. Below is an overview of some of the different ways the CITRUS modules can be used:
Preprocessing
Preprocessing Example 1
MVP preprocessing. If nothing other than numeric_operation_list = NA, the preprocessing will default to RFM preprocessing if no categorical columns exist in the data set. It can be used in e.g. unsupervised learning.
formatted <- preprocess(citrus::transactional_data, numeric_operation_list = NA)Preprocessing Example 2
Aggregating the numeric columns using the ‘min’ and standard deviation ‘sd’. Uses the most common category for each user in the column ‘country’. The target column is the mean of the transactionvalue column.
formatted <- preprocess(citrus::transactional_data,
                        categories = c('country'),
                        numeric_operation_list = c('min', 'sd'),
                        target = 'desc_chars',
                        target_agg = 'mean')
#> Calculating target values
Data Validation
Data Validation Example 2
DF invalid because the ‘response’ column is missing and the id column is not unique
hyperparameters = list(dependent_variable = 'response',
                       min_segmentation_fraction = 0.05,
                       number_of_segments = 6,
                       print_safety_check=20)

invalid_df <- formatted %>%
  select(-response)

validate(invalid_df, supervised = TRUE,hyperparameters = hyperparameters)
#> Error in validate(invalid_df, supervised = TRUE, hyperparameters = hyperparameters):
#>
#> Columns missing: response
Data Validation Example 3
DF invalid because only the id, and response column exists, there are no feature columns to predict over.
Data Validation Example 4
Successful validation
validate(formatted, supervised = TRUE, hyperparameters = hyperparameters)
#> [1] TRUE
Segment
Segment Example 1
Runs the default decision tree optimisation function to segment the customers. Skips the ‘preprocess’ step and goes straight from the ‘model’ step and onwards. Instructed to prettify the plot and display it
output <- segment(citrus::preprocessed_data,
                  modeltype = 'tree',
                  steps = c('model'),
                  prettify = T,
                  print_plot = TRUE)
Segment Example 2
Uses a user defined function to classify the customers Skips the ‘preprocess’ step and goes straight from the ‘model’ step and onwards. No hyper parameters passed
my_custom_function <- function(df) {

  final_df <- df %>%
    mutate(first_letter = substring(top_country, 1, 1)) %>%
    mutate(segment = ifelse(match(tolower(first_letter), tolower(LETTERS)) <= 8, 'Segment A',
                                      ifelse(match(tolower(first_letter), tolower(LETTERS)) <= 17, 'Segment B', 'Segment C'))) %>%
    arrange(desc(id))

  #output <- list('predicted_values' = final_df[,c('segment')])
  output <- list('predicted_values' = final_df[,c('id', 'segment')])

  return(output)
}
output <- segment(citrus::preprocessed_data,
                  modeltype = 'tree',
                  FUN = my_custom_function,
                  FUN_preprocess = NULL,
                  steps = c('model'))
Segment Example 3
MVP segmentation. Uses both the default preprocess step and the default model step
output <- segment(citrus::transactional_data, prettify = TRUE, print_plot = TRUE)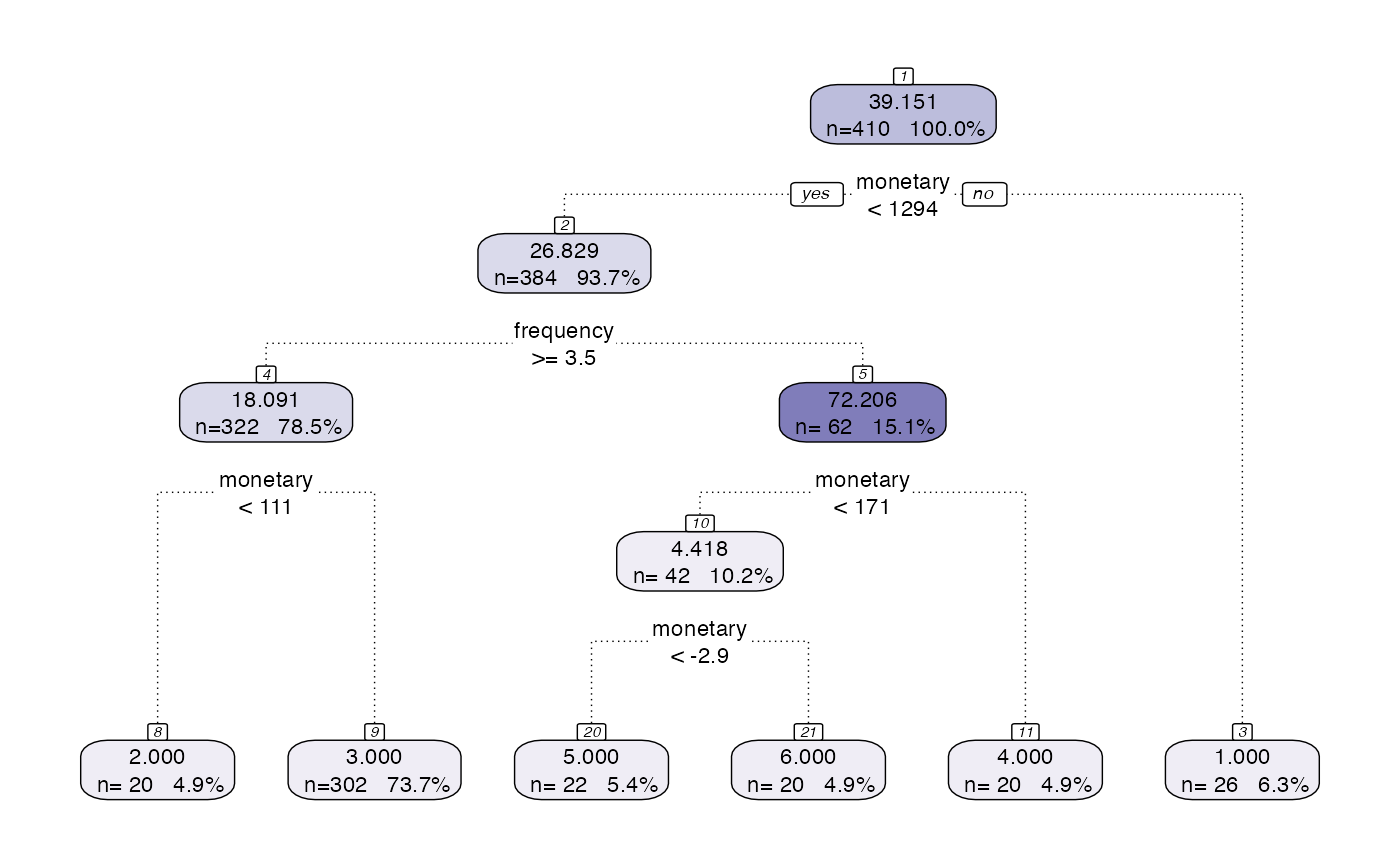
Segment Example 4
MVP segmentation for unsupervised learning Uses both the default preprocess step and the default model step
output <- segment(citrus::transactional_data %>% select(-desc_chars), modeltype = 'k-clusters', prettify = TRUE)
#> Registered S3 method overwritten by 'GGally':
#>   method from
#>   +.gg   ggplot2
Model Abstraction
Model Abstraction Example 1
The model abstraction layer takes the output of the model segment layer and extracts the relevant information and converts it into a model class ready for the model management layer.
hyperparameters <- list(dependent_variable = 'response',
                       min_segmentation_fraction = 0.05,
                       number_of_segments = 6,
                       print_plot = FALSE,
                       print_safety_check=20)

model <- tree_segment(citrus::preprocessed_data, hyperparameters)
model <- tree_segment_prettify(model,print_plot = T)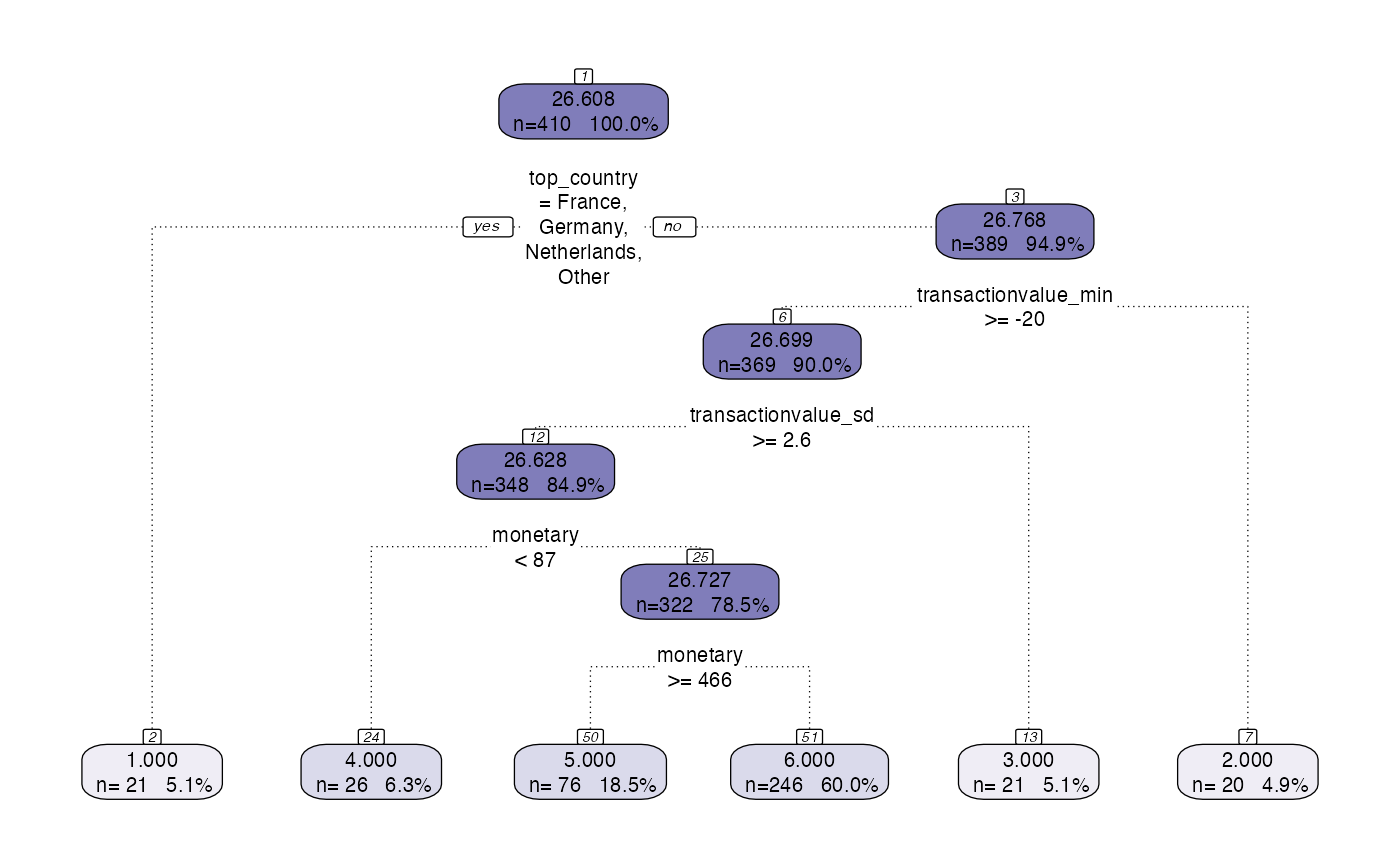
model <- tree_abstract(model, citrus::preprocessed_data)Model Management
Model Management Example 1
The model management layer is used to store the model outputs and relevant metadata, this is defaulted to not save. To get this layer to work, in the hyperparameters at the start, the saveoutput hyperparameter can be changed to save the relevant model outputs.
hyperparameters <- list(dependent_variable = 'response',
                       min_segmentation_fraction = 0.05,
                       number_of_segments = 6,
                       print_plot = FALSE,
                       print_safety_check=20,
                       saveoutput = T)

model <- tree_segment(citrus::preprocessed_data, hyperparameters)
model <- tree_segment_prettify(model,print_plot = T)
model <- tree_abstract(model, citrus::preprocessed_data)
model_management(model,hyperparameters)
#> agg_png
#>       2
Output Layer
Output Layer Example 1
The output layer takes the output of the model segment and abstraction layer and produces the output table.
hyperparameters <- list(dependent_variable = 'response',
                       min_segmentation_fraction = 0.05,
                       number_of_segments = 6,
                       print_plot = FALSE,
                       print_safety_check=20)

model <- tree_segment(citrus::preprocessed_data, hyperparameters)
model <- tree_segment_prettify(model,print_plot = T)
model <- tree_abstract(model, citrus::preprocessed_data)
model_management(model,hyperparameters)
output_table(citrus::preprocessed_data,model)
#> # A tibble: 6 × 16
#>   segment     n mean_value percentage frequency_mean frequency_range
#>     <int> <int>      <dbl> <chr>               <dbl> <chr>
#> 1       1    21       23.7 5.1%                17.6  1 - 84
#> 2       2    20       28.0 4.9%                15.6  1 - 96
#> 3       3    21       27.9 5.1%                18.8  2 - 63
#> 4       4    26       25.4 6.3%                 1.88 1 - 5
#> 5       5    76       26.2 18.5%               43.4  1 - 297
#> 6       6   246       26.9 60%                 20.8  1 - 96
#> # … with 10 more variables: monetary_mean <dbl>, monetary_range <chr>,
#> #   recency_mean <dbl>, recency_range <chr>, top_country_mode <chr>,
#> #   top_country_top5 <chr>, transactionvalue_min_mean <dbl>,
#> #   transactionvalue_min_range <chr>, transactionvalue_sd_mean <dbl>,
#> #   transactionvalue_sd_range <chr>
Pair-plot vizualisation
formatted <- preprocess(citrus::transactional_data,
                        categories = c('country'),
                        numeric_operation_list = c('min', 'sd'),
                        target = 'desc_chars',
                        target_agg = 'mean')
#> Calculating target values

output <- segment(formatted,
                  modeltype = 'tree',
                  steps = c('model'),
                  prettify = TRUE,
                  print_plot = TRUE)
citrus_pair_plot(output$CitrusModel, vars = c("frequency","monetary"))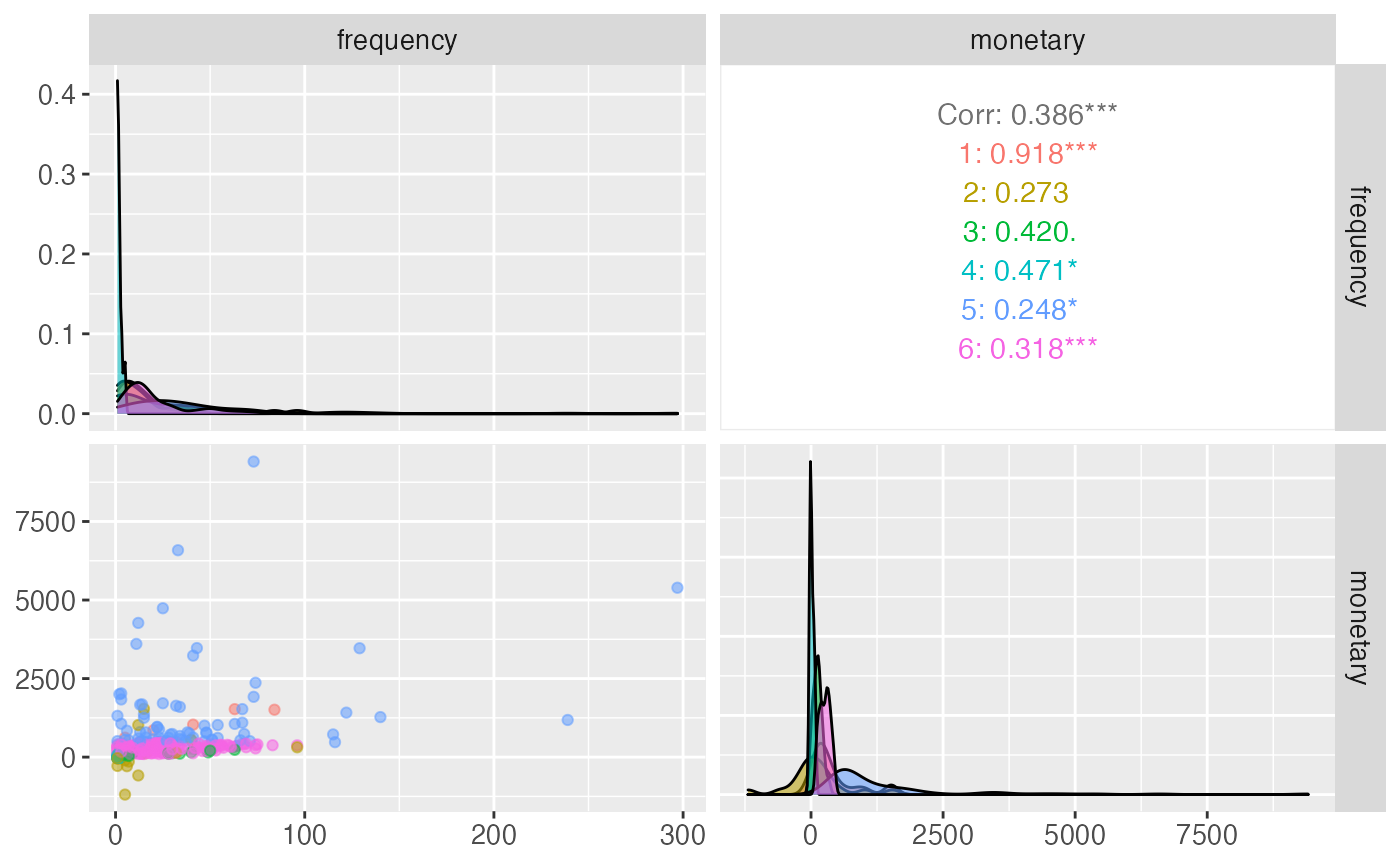
Full Workflow
CITRUS can be run simply with the segment function or can be more advanced, using each module by line as below.
hyperparameters <- list(dependent_variable = 'response',
                       min_segmentation_fraction = 0.05,
                       number_of_segments = 6,
                       print_plot = FALSE,
                       print_safety_check=20)

formatted <- preprocess(citrus::transactional_data,
                       categories = c('country'),
                       numeric_operation_list = c('min', 'sd'),
                       target = 'desc_chars',
                       target_agg = 'mean')
#> Calculating target values
validate(formatted, supervised = TRUE, hyperparameters = hyperparameters)
#> [1] TRUE
model <- tree_segment(formatted, hyperparameters)
model <- tree_segment_prettify(model,print_plot = T)
model <- tree_abstract(model, citrus::preprocessed_data)
model_management(model,hyperparameters)
output_table(citrus::preprocessed_data,model)
#> # A tibble: 6 × 16
#>   segment     n mean_value percentage frequency_mean frequency_range
#>     <int> <int>      <dbl> <chr>               <dbl> <chr>
#> 1       1    21       23.7 5.1%                17.6  1 - 84
#> 2       2    20       28.0 4.9%                15.6  1 - 96
#> 3       3    21       27.9 5.1%                18.8  2 - 63
#> 4       4    26       25.4 6.3%                 1.88 1 - 5
#> 5       5    76       26.2 18.5%               43.4  1 - 297
#> 6       6   246       26.9 60%                 20.8  1 - 96
#> # … with 10 more variables: monetary_mean <dbl>, monetary_range <chr>,
#> #   recency_mean <dbl>, recency_range <chr>, top_country_mode <chr>,
#> #   top_country_top5 <chr>, transactionvalue_min_mean <dbl>,
#> #   transactionvalue_min_range <chr>, transactionvalue_sd_mean <dbl>,
#> #   transactionvalue_sd_range <chr>