K clustering
KProto.RmdThe CITRUS package also offers the option to perform segmentation using unsupervised learning. The k_clusters function will perform either k-means or k-prototypes clustering based on the data types present in the input data frame. Both methods take a customer level data frame and cluster the data into segments based on a distance parameter between data points. If any categorical columns are detected then k-prototypes will be implemented, otherwise k-means. Use this model if you want to create clusters without using a target variable to segment on. This model is particularly good at handling mixed data types.
Some Examples
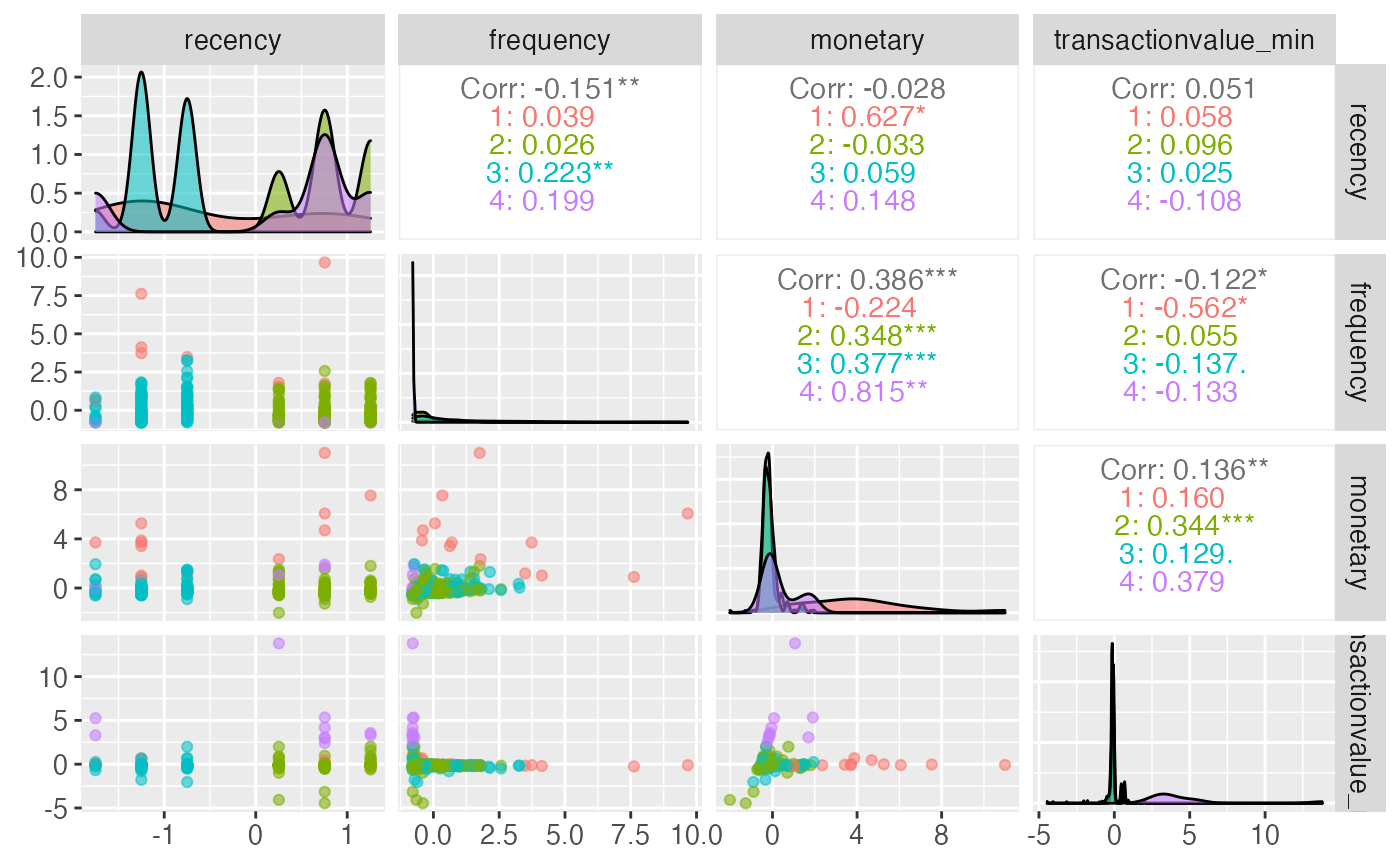
One approach to run this type of segmentation is by using the segment function. Within the segment function there is a parameter called modeltype that can be set to k-clusters. Depending on what is defined in steps (see https://peak-ai.github.io/CITRUS/articles/segment.html), this will run the pipeline and the unsupervised functions to produce the output table, predicted values and the model object. The segment function requires a data frame to segment upon, and also some parameters that provide a prettified output and a pair plot.
output <- segment(citrus::preprocessed_data %>% select(-response, -transactionvalue_sd, -top_country),
                  modeltype = 'k-clusters',
                  steps = c('model'),
                  prettify = T,
                  print_plot = TRUE)
#> Registered S3 method overwritten by 'GGally':
#>   method from
#>   +.gg   ggplot2
Another approach can be called by using the k_clusters function. Within the k_clusters function there are hyperparameters that require to be passed as a list object and the dataframe that will be used to segment. The output provided is a list containing the segmentation object (segment_model), the input data (input_data), the predicted values (predicted_values) a table with any outliers (outliers_table), the model input parameters (model_hyperparameters) and, in case k-means is used, an elbow-plot showing the optimised number of clusters (elbow_plot).
hyperparameters <- list(centers = 'auto',
                                       iter_max = 50,
                                       nstart = 5,
                                       max_centers = 5,
                                       segmentation_variables = NULL,
                                       standardize = TRUE)
model <- k_clusters(citrus::preprocessed_data %>% select(-top_country, -response, -transactionvalue_sd), hyperparameters)
#> Checking for NAs in variables
#> Variables have 0 NAs
#> Data contain only numeric feautures: using kmeans algorithm
#> Optimising number of clusters
#> Number of optimal clusters: 4
#> Number of rows: 410
Hyperparameters
Both k-means and k-prototype use certain hyperparameters that help prevent over/underfitting. The hyperparameters for this approach can be seen below. When the hyperparameter list is not specified in the segment function, a list of default value is used. It is possible to change the value of any of the hyperparameters and pass the new list to the segment function.
| Hyperparameter Name | Description |
|---|---|
| centers | number of clusters or a set of initial (distinct) cluster centers, or ‘auto’. When ‘auto’ is chosen, the number of clusters is optimised |
| iter_max |
numeric, the maximum number of iterations allowed |
| nstart |
numeric, how many random sets of cluster centers should be tried |
| max_centers |
numeric, maximum number of clusters when ‘auto’ option is selected for the centers |
| segmentation_variables |
array, the columns to use to segment on |
| standardized |
boolean, whether to standardize numeric columns |
hyperparameters <- list(centers = 3,
                        segmentation_variables = c("frequency", "recency"))
output <- segment(citrus::preprocessed_data %>% select(-response, -top_country, -transactionvalue_sd),
                  modeltype = 'k-clusters',
                  steps = c('model'),
                  prettify = T,
                  hyperparameters = hyperparameters,
                  print_plot = TRUE)